dolution.
CASE
MOBILE PHONE QUALITY AND PRICE
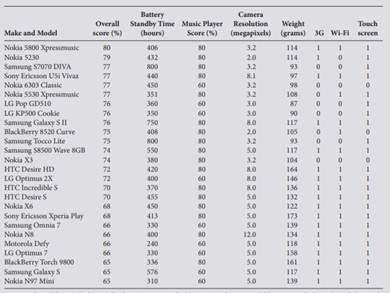
Worldwide sales of mobile phones are a multibillion pound business. There is severe competition among the major manufacturers to attract higher sales and greater market shares. To achieve this, companies compete with each other on price. However, for many customers price may not be as important as the perceived quality of the phone, especially as many phones are marketed at ‘zero price’ under a wide variety of plans and packages being offered by service providers. Today, the range of mobile phones available is huge, as are the functions offered. Oft en viewed as more of a fashion accessory or a ‘must have’ item rather than simply a phone, today’s consumers are demanding a range of attributes such as in-built camera, GPS navigation, compatibility with 3G network, a colour display, and inbuilt MP3 player. Of course, it should also be able to make or receive phone calls. The independent consumer advice charity which? regularly conducts extensive surveys of numerous makes and models of mobile phones on off er and gives them an overall rating score, as well as rating scores for a variety of other categories. Some qualitative information on the phones is also given. The ratings given are then ranked and a Which? ‘Best Buy’ list is produced, of which the table below is an extract. Decision makers and marketers at mobile phone manufacturers would like to know what features of a mobile phone are important for consumers. This would be especially important in helping to design effective marketing and advertising campaigns. They need to know not only what the important factors are, but also which the most important ones are. For example, more consumers are now looking for 3G network compatibility. Out of the 26 mobile phones that were included in the table, all had Bluetooth (this variable was therefore excluded as it did not provide any additional information), 18 were compatible with the 3G network, 19 had Wi-Fi and 23 had a touch screen. In purchasing a mobile phone with a camera, an obvious factor consumers would consider would be the quality of the picture so the resolution of the camera (in megapixels) is included. The battery standby time, the rating of the music player and the weight of the phone are some of the other factors that may influence a consumer’s choice of mobile phone. The following table shows Which? Best Buy overall ratings for 26 phones, along with their music player scores. The table also shows the resolution of the camera, the battery standby time and whether the phone is 3G compatible, whether it has Wi-Fi and a touch screen.

dolution
"Looking for a Similar Assignment? Get Expert Help at an Amazing Discount!"

![]() Ă‚Â Marketing by Leo J. Shapiro & Associates, 66% of all computer companies are going to spend more on marketing this year than in previous years. Only 33% of other information technology companies and 28% of non-information technology companies are going to spend more. Suppose a researcher wanted to conduct a survey of her own to test the claim that 28% of all non-information technology companies are spending more on marketing next year than this year. She randomly selects 270 companies and determines that 62 of the companies do plan to spend more on marketing next year. Use
Ă‚Â Marketing by Leo J. Shapiro & Associates, 66% of all computer companies are going to spend more on marketing this year than in previous years. Only 33% of other information technology companies and 28% of non-information technology companies are going to spend more. Suppose a researcher wanted to conduct a survey of her own to test the claim that 28% of all non-information technology companies are spending more on marketing next year than this year. She randomly selects 270 companies and determines that 62 of the companies do plan to spend more on marketing next year. Use ![]() 0.05, the chi-square goodness-of-fit test, and the sample data to test to determine whether the 28% figure holds for all non-information technology companies.
0.05, the chi-square goodness-of-fit test, and the sample data to test to determine whether the 28% figure holds for all non-information technology companies.


